
Technical guide
How can a performance problem be investigated with evidence rather than assumptions?
A performance investigation starts with a measurement question: which operation, for whom, under what conditions and how slow? Then a baseline is set, the time spent is measured along the call chain, and the bottleneck is told apart from the symptom. The effect of a change is not reported as an outcome until it has been measured again under the same conditions.
- Prepared by Castintech
- Last verified 23 September 2026
- 12 min read
- Sources
In this guide
Sections
Scope. This guide is a general investigation method for performance problems in SAP® software landscapes, and particularly in custom code written in the ABAP® programming language. The names and scope of monitoring and tracing tools vary with the product and release; this guide does not describe any particular tool. The principles are general engineering knowledge and are not attributed to SAP.
Text description of the diagram
Start: the symptom; “the system is slow” is an observation, not a measurable question. The symptom is turned into a measurement question with five items: operation or scenario, user group, time window, expected and observed duration, business impact. Next, the baseline is built as a distribution, not a single measurement: a representative histogram marked with the average, a percentile and the longest duration. The call chain splits time into database access, application logic, external system calls, network, locks and resource waits, and user interface; one item is marked as the hypothesis item X. Decision point 1: bottleneck or symptom? Hypothesis: if X is reduced, total time should drop; X is measured in isolation. If not confirmed, a dashed return path goes back to the call chain and the investigation moves to the next item. If confirmed, one change is made. It is then re-measured under the same conditions; this frame has the same width and axis as the baseline, the baseline silhouette is shown dashed only for comparison, and no new result is drawn. The bracket joining the two frames shows the same conditions: concurrent load and running batch jobs, data volume and distribution, selection criteria, cache state and the same protocol. Boundary: a measurement in a test environment gives a direction; it is not evidence of live behaviour. Decision point 2: is the effect proven under the same conditions? If not, no result is claimed and the effect stays a hypothesis; that branch ends there. End: if proven, a reproducible evidence pack; raw results are kept apart from interpretation, and the difference within which two results count as the same is defined before measuring. Apart from the single return path of the bottleneck hypothesis there is no loop. Chart scales are representative, not measured values. On mobile the diagram reads as three panels in order: 1/3 symptom, measurement question and baseline, 2/3 context, call chain and bottleneck, 3/3 one change, re-measure and evidence. Colophon: Castintech, D4, September 2026; technical explanatory diagram, not an SAP® product interface.
How is a measurement question framed?
“The system is slow” is an observation, not a question you can measure. A measurement question covers the operation or scenario, the affected user group, the time window, the expected and observed duration, and the business impact. An investigation that starts without these five items tends to focus on whatever is easiest to measure, not on what matters most.
Measurement question template:
| Item | Example form |
|---|---|
| Operation or scenario | Running a specific report with specific selection criteria |
| User group | Which role or unit is affected |
| Time window | Which hours of the day, which days of the month |
| Expected and observed | The duration the business can accept, and the duration seen today |
| Business impact | Which business outcome the delay affects |
Why is a baseline needed?
A baseline is a measurement of the current state under defined conditions. Without one, the effect of a change cannot be shown. It is set from a distribution rather than a single measurement: alongside the average, it records percentiles showing the time within which most operations finish, and the longest durations.
An average can hide operations that are rare but take a very long time. The problem users feel is often in that long tail. So the baseline states plainly which statistic is used, and later measurements use the same one.
Why record runtime and data volume context?
The same operation runs for different lengths of time under different conditions. If the concurrent load, running batch jobs, volume of data processed, data distribution, selection criteria and cache state are not recorded at the time of measurement, two measurements cannot be compared.
This context matters as much as the measurement itself, because it shows under which conditions the result holds. Data volume matters especially. An operation that runs quickly on a small data set can slow down disproportionately as the data grows. So the number of records processed and the selection criteria are written down with the measurement; otherwise you cannot tell whether the slowness comes from the code or from the data.
Which variables distort a measurement?
Some variables change the measured duration even though they have nothing to do with the problem. If they are not controlled, or at least recorded, a difference between two measurements can be pinned on the wrong change. The variables below are reviewed for each measurement; any that cannot be controlled are noted and taken into account when interpreting the result.
- a cache that is empty on the first run and warm on later runs
- batch jobs, backups or heavy user traffic running at the same time
- changes in data volume or distribution between measurement periods
- users with different authorisations seeing different amounts of data
- fluctuating network latency and the current state of other systems
- the overhead of the measurement or tracing tool itself
- periodic peaks such as month-end
If a variable is suspected, an extra measurement is made that changes only that variable. That shows separately how much of the observed difference comes from it.
Which sources does the evidence come from?
No single source shows the whole of a performance problem. System-level monitoring data shows resource usage, traces show how much time an operation spends in each step, and database access statistics show which queries run, how often and with how much data.
Application logs and batch job records show timing, and the duration a user measures shows how the work actually feels.
These sources are used together so they can confirm one another. If a trace shows that a query takes a long time, database statistics can confirm how much data the same query read in that period. If the sources contradict each other, the contradiction is itself a finding, and the measurement conditions are checked again. Which tool provides these sources varies with the product and release; the evidence pack records which source each measurement came from.
Actual product screen
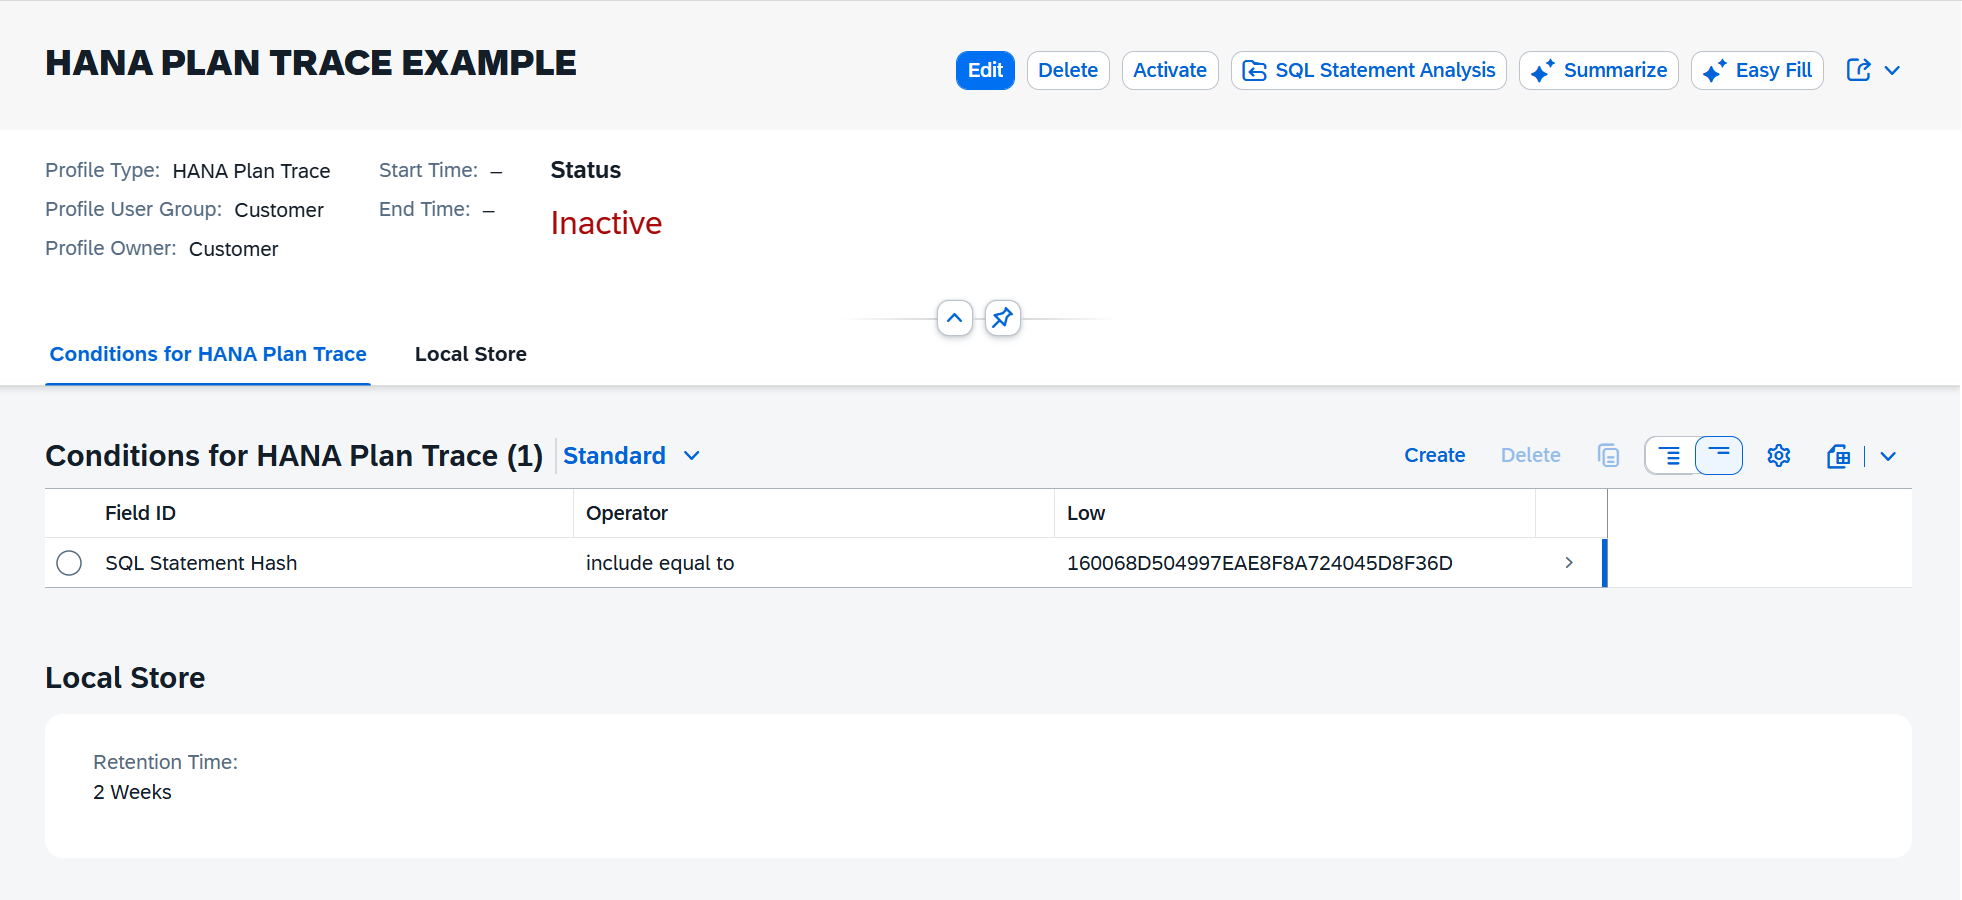
Scroll horizontally to read the screen, or select the image to open it at full size.
What the screen shows A “HANA Plan Trace” profile in the request statistics capture app: a single SQL statement hash is defined as the condition, the profile is inactive, and local retention is 2 weeks.
Decision it explains When evidence is collected, the trace is limited to a single statement and the retention period is set up front; the measurement stays limited to the question under investigation, and the evidence file can state the condition under which it was captured.
Data The image contains no business data: the profile is named “HANA PLAN TRACE EXAMPLE” and the owner field shows the generic “Customer” label. The statement value shown is a hash; it does not reveal the query text.
Product: SAP BTP, ABAP environment — Capture Request Statistics Source: SAP-docs/btp-cloud-platform © 2021-2023 SAP SE or an SAP affiliate company and https://github.com/sap-docs/btp-cloud-platform contributors License: CC BY 4.0, used without modification
Where is the time being spent?
Until the total time is broken down along the call chain, you cannot know which change will help. Time is usually spread across these items: database access, application logic, calls to external systems, the network, lock and resource waits, and the user interface. The investigation measures the share falling to each.
Patterns commonly seen in ABAP code are also confirmed by this measurement, not by guesswork. Database access repeated inside a loop, reading more data than needed, or processing the same data several times can all be sources of trouble. But finding a pattern in the code does not show that it is the main bottleneck; measurement does.
How is the bottleneck told apart from the symptom?
A symptom is the observed result: a long duration, high processor usage, a full queue. The bottleneck is the constraint that, once reduced, actually reduces the total time. High processor usage may be the symptom of an inefficient loop, while the real bottleneck is elsewhere, for example in waiting for an external call.
Reducing a symptom does not mean removing the bottleneck. The distinction is made with a hypothesis: “the time grows because of item X; if X is reduced, total time should fall by this much.” The hypothesis is tested with a measurement that isolates X. If it is not confirmed, the bottleneck is elsewhere and the investigation moves on to the next item.
How is measurement made repeatable?
A repeatable measurement gives the same result under the same conditions. That means using the same data and selection criteria, and measuring either in the same time window or under a controlled load. The measurement is repeated several times and the spread of results is recorded; a single run can make a random deviation look like a result.
The measurement protocol is written down: how it was started, under which conditions, how many times and which statistic was used to summarise it. The same protocol is applied to the measurement after the change. If the protocol changes, the two measurements cannot be compared, and the report says so.
How can another team reproduce the evidence?
Evidence that only the person who collected it can repeat is not strong enough for a decision. Reproducible evidence is evidence that another team can reach by following the same steps. That means the measurement steps, the data used, the version and configuration of the environment, and the raw results are kept separately from their interpretation.
Small differences are normal when evidence is reproduced. So how far apart two results can be and still count as “the same” is defined before measuring. If the difference falls outside that limit, the difference in conditions between the two measurements is investigated, and the result is not used for a decision until it is explained. Keeping raw results also allows the interpretation to be revisited later.
How are the before and after states verified?
Make one change at a time and measure its effect with the same protocol. When several changes are made at once, you cannot tell which one helped; one may have improved things while another made them worse. The comparison uses the same distribution statistics as the baseline, not just the average.
The result is reported in the same form as the baseline. Side effects are checked too: other operations using the same data, batch jobs sharing the same resources, or integrations may have been affected. A change that speeds up one operation and slows down another may not count as an improvement for the business.
Why is an unmeasured gain not claimed?
An estimated improvement is not a measured one. “This change will shorten the duration” is a hypothesis and is written as one. Only before and after values measured under the same conditions go into the results report. If measurement was not possible, that is stated plainly, along with which measurement could be made instead.
This rule protects management decisions. An unmeasured gain can be used as if it were real data in the next budget or priority decision, and when it fails to materialise, the basis for that decision disappears.
What are the limits of comparing environments?
Test and production environments can differ in data volume, data distribution, configuration, concurrent load and hardware. A measurement in a test environment points in a direction; it is not evidence of behaviour in production. The report states which environment the measurement was taken in and how that environment differs from production.
If measurement in production is needed, the overhead of the measurement tools and the measurement window are planned in advance. The measurement is carried out so that it does not affect the business process, and with the knowledge of the relevant owners.
What goes into an evidence pack?
| Field | Content |
|---|---|
| Measurement question | Operation, user group, time window, expected and observed, business impact |
| Environment and conditions | Environment, concurrent load, data volume, selection criteria, cache state |
| Protocol | How it was started, number of repetitions, summary statistics |
| Baseline | Distribution: average, percentiles, longest duration |
| Time breakdown | Share by item along the call chain |
| Hypotheses | Hypotheses tested and their results |
| Change | The single change made and its reason |
| After measurement | Distribution measured with the same protocol; side-effect check |
| Limits | What could not be measured, environment differences, open assumptions |
Common wrong assumptions
- “The operation using the most resources is the source of the problem.” Heavy resource use does not make it the bottleneck; measurement has to show its effect on total time.
- “If it is fast in test, it will be fast in production.” Differences in data volume and load can change the result completely.
- “If the average improved, users will feel the improvement.” If the operations in the long tail did not change, users may notice no difference.
- “If the code contains a known bad pattern, that is the problem.” The presence of a pattern does not show its effect; its effect is measured.
- “Making several changes together saves time.” You cannot tell which one helped, and one may mask the effect of another.
Checklist
- The measurement question is written with its five pieces of information
- The baseline is set with distribution statistics
- Environment, load, data volume and selection criteria are recorded
- Variables that could distort the measurement are controlled or recorded
- Time is broken down into items along the call chain
- A bottleneck hypothesis is written and tested with an isolating measurement
- A measurement protocol is written and applied over several repetitions
- Measurement steps, data, environment details and raw results are kept so another team can reproduce them
- One change is made at a time
- The after measurement uses the same protocol; side effects are checked
- Environment differences and what could not be measured are written into the report
- No unmeasured gain is reported as an outcome
Limits of this guide
This guide is a general engineering explanation and does not rest on any product documentation. SAP tool names and product-specific settings are deliberately left out; they vary by product and release and should be confirmed in your landscape. We do not claim any particular speed-up, resource usage or duration outcome.
Frequently asked questions
Why is the average duration not enough?
An average can hide rare but very long operations among many short ones. The delay users complain about is often in those long operations. Percentiles and the longest durations make that part visible.
Is a user complaint evidence on its own?
A complaint is the starting point of an investigation, not its evidence. The information in the complaint (which operation, when, how slow) is turned into a measurement question and confirmed by measurement.
Does adding hardware solve a performance problem?
In some cases it can shorten durations, but a hardware upgrade made before the bottleneck is identified can hide the problem, and the problem can return as the data grows. The decision should be made once it has been measured whether the bottleneck is a lack of resources or inefficient access.
Is measuring in production risky?
Measurement tools can add overhead. That overhead is limited by planning the measurement window and scope in advance. The measurement is carried out with the knowledge of the relevant owners and at a time when it will not affect the business process.
How should the outcome of an improvement be reported to management?
Report the before and after distributions measured with the same protocol, the environment and conditions of the measurement, the side-effect check and what could not be measured, all together. An unmeasured gain does not go into the report as an outcome.
When should a performance investigation stop?
It stops when the acceptable duration defined in the measurement question is reached, or when the cost of removing the remaining bottleneck starts to exceed its business impact. That decision is also made with evidence and together with the business owner, and the state reached is recorded against the baseline.
Related pages and guides
- Our working approach: why we do not report outcomes that were not measured
- Error handling and safe reprocessing in integrations: monitoring waiting messages and timings for integration delays
- Custom code inventory and technical debt: where performance findings sit in the inventory
- All technical guides
Sources
This guide does not rest on any product documentation. The content is general engineering knowledge and Castintech’s investigation framework, and is not attributed to SAP. The guide contains no externally sourced claims.
Last verified: 23 September 2026
SAP and ABAP are the trademarks or registered trademarks of SAP SE or its affiliates in Germany and in other countries.
This content has been independently prepared by Castintech.
Independence note
- Castintech does not claim any partnership, authorization, endorsement or sponsorship relationship with SAP SE.
- SAP and the SAP product names mentioned on this page are trademarks of SAP SE or its affiliates.
- The work Castintech offers is independent technical consulting and support.